 Staffing Curve
Know how many agents each interval needs — and where your roster falls short.
The Erlang C Staffing Planner is a Power BI visual. Drop in forecast contacts, handle time and your schedule, and it calculates required staffing for every interval, inside your report, on your machine.
Why a visual, and not a DAX measure
Charting contact volume in Power BI is easy. Turning it into a defensible staffing requirement is not. Erlang C is awkward to write in DAX, spreadsheet macros are fragile, Python visuals bring deployment and refresh problems, and sending contact data to an external calculator is a procurement conversation nobody wants. This visual does the calculation where the data already is.
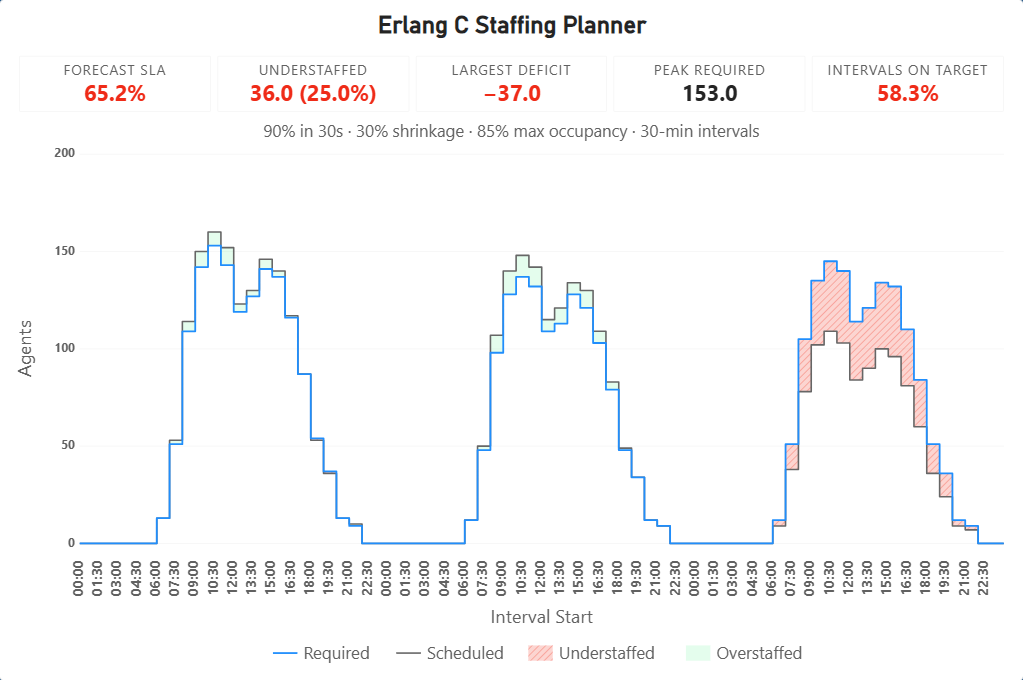
Required staffing, every interval
Productive agents from Erlang C, then scheduled agents after shrinkage. Thirty thousand intervals in under a tenth of a second.
The gap against your actual roster
Map your schedule and the chart shades every understaffed interval, with the forecast service level your roster will deliver.
Occupancy as a hard constraint
Calculators that only target service level hand you answers implying 90% occupancy. This one won't, unless you raise the ceiling yourself.
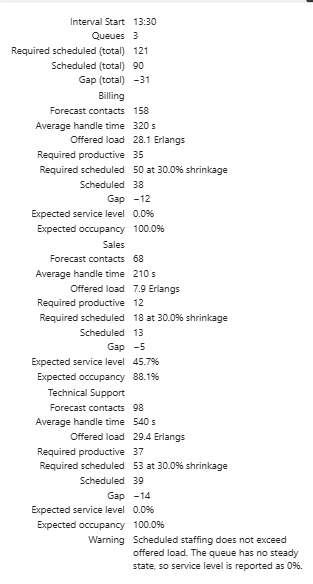
Every number reconcilable
Hover any interval and see the whole chain — offered load in Erlangs, required productive, required scheduled. Check it against your spreadsheet.
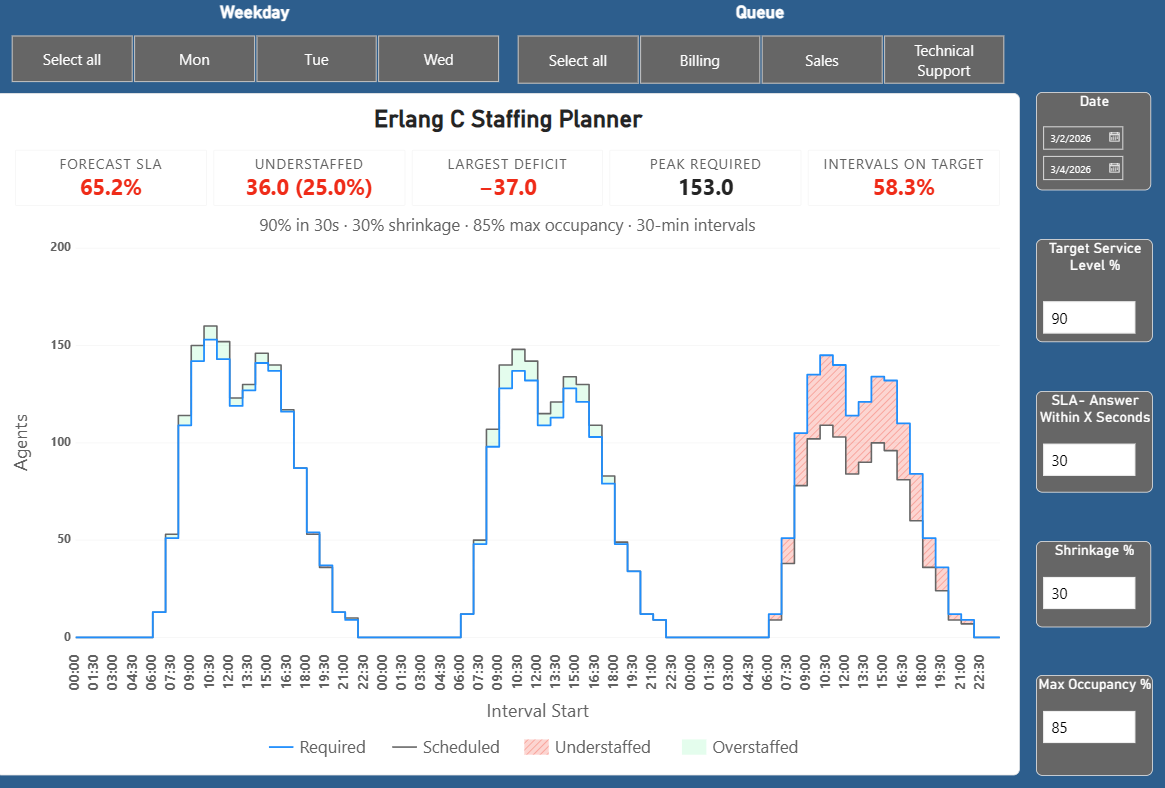
Readers run their own scenarios
Bind what-if parameters to service level, threshold, shrinkage or occupancy, and report readers explore from a slicer without editing anything.
Your data stays yours
No network requests, no web-access permissions, no external services. Contact volumes never leave your tenant.
Numerically sound at any volume
The engine uses the stable Erlang B recurrence rather than the textbook factorial form, which overflows and returns NaN above 170 agents — around a thousand contacts in a half-hour at a five-minute handle time. Results are verified against exact rational arithmetic, agreeing to within a few units in the last place at every load tested, up to 500 Erlangs.
The same engine runs the free Erlang C calculator at erlangcalc.com, so a single interval checked there matches the visual to the digit.
Try it on your own data
Evaluation Mode is free and permanent: it calculates your intervals with your parameters over a limited range, with the full calculation chain in every tooltip. Check the arithmetic against your spreadsheet before you spend a dollar. A licence unlocks the full range, roster comparison, gap shading, summary metrics and multi-queue support — $7 per user per month.
Get it on AppSource